
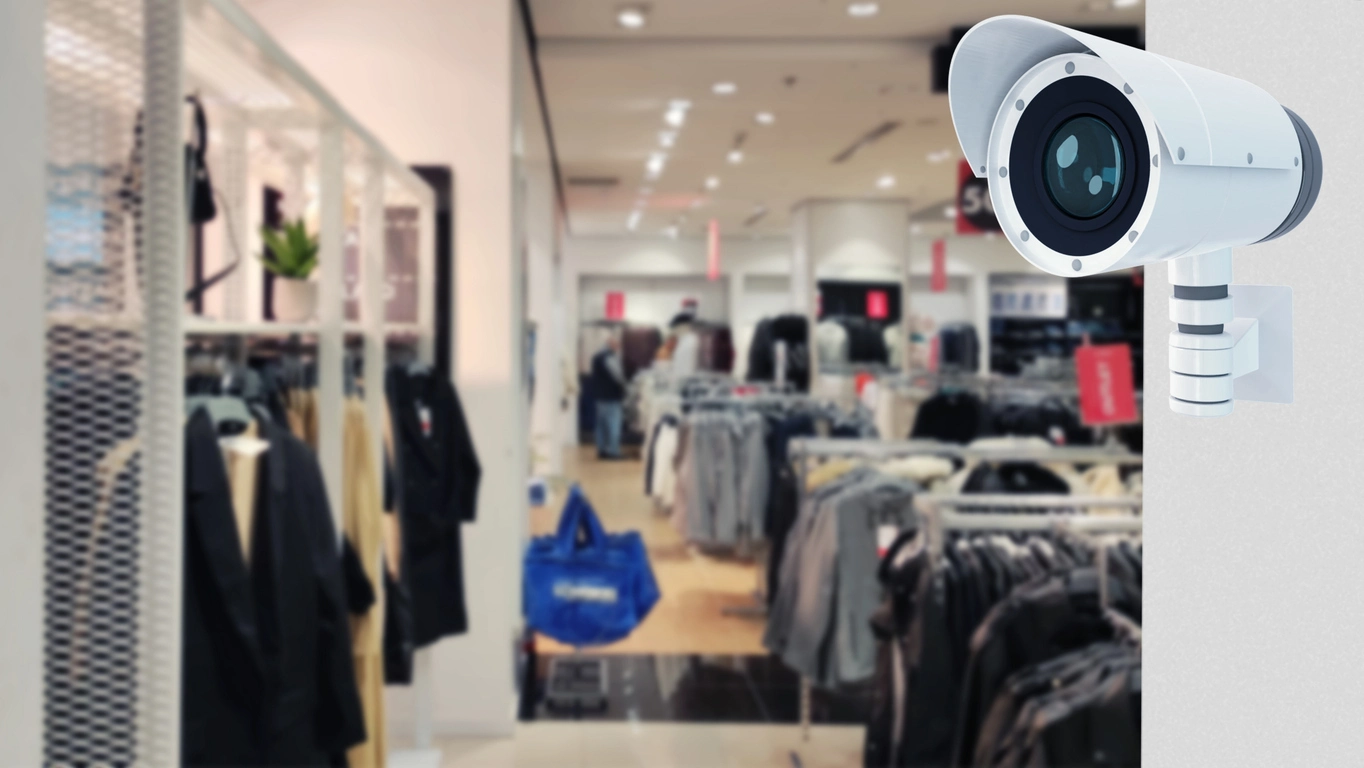
Retail Sales Floors
Visualize customer movement around aisles, displays, and merchandise areas.
AI Heat Mapping
Camera Security Now helps organizations evaluate video heat mapping analytics that visualize where people move, gather, and spend time within monitored commercial spaces.
Heat mapping turns repeated movement or dwell activity into a visual representation of high-traffic and low-traffic areas.
Retailers, facility managers, hospitality operators, and other organizations may use heat maps to understand customer flow, space utilization, display performance, waiting behavior, or operational bottlenecks.
Heat maps show aggregated spatial patterns rather than explaining why people behaved a certain way, so they are most useful when combined with business context and other analytics.
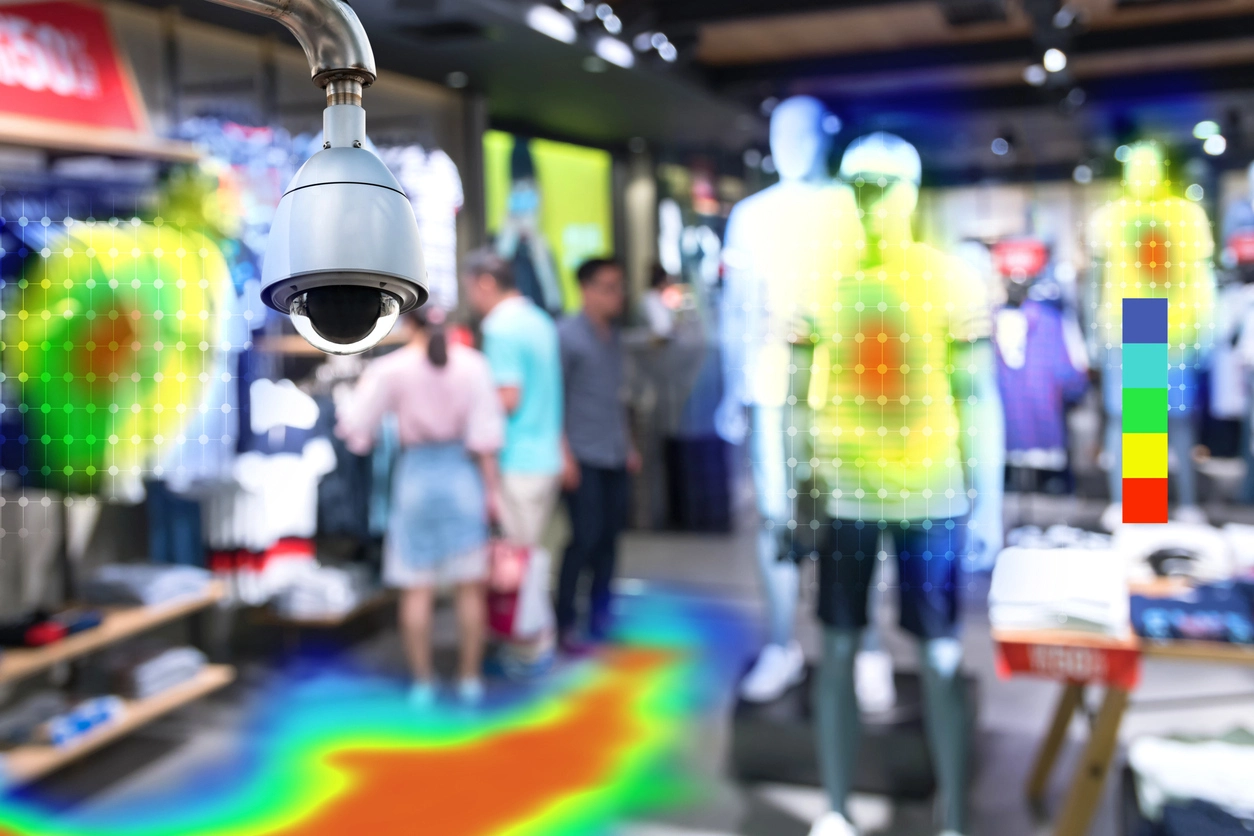
Heat maps make movement patterns easier to understand at a glance.
See which areas receive the most or least movement over a selected time period.
Identify locations where people tend to remain longer when supported analytics include dwell data.
Use movement patterns to inform layout, signage, staffing, merchandising, or facility-use decisions.
Heat mapping is especially useful in spaces where understanding movement patterns supports business decisions.
Visualize customer movement around aisles, displays, and merchandise areas.
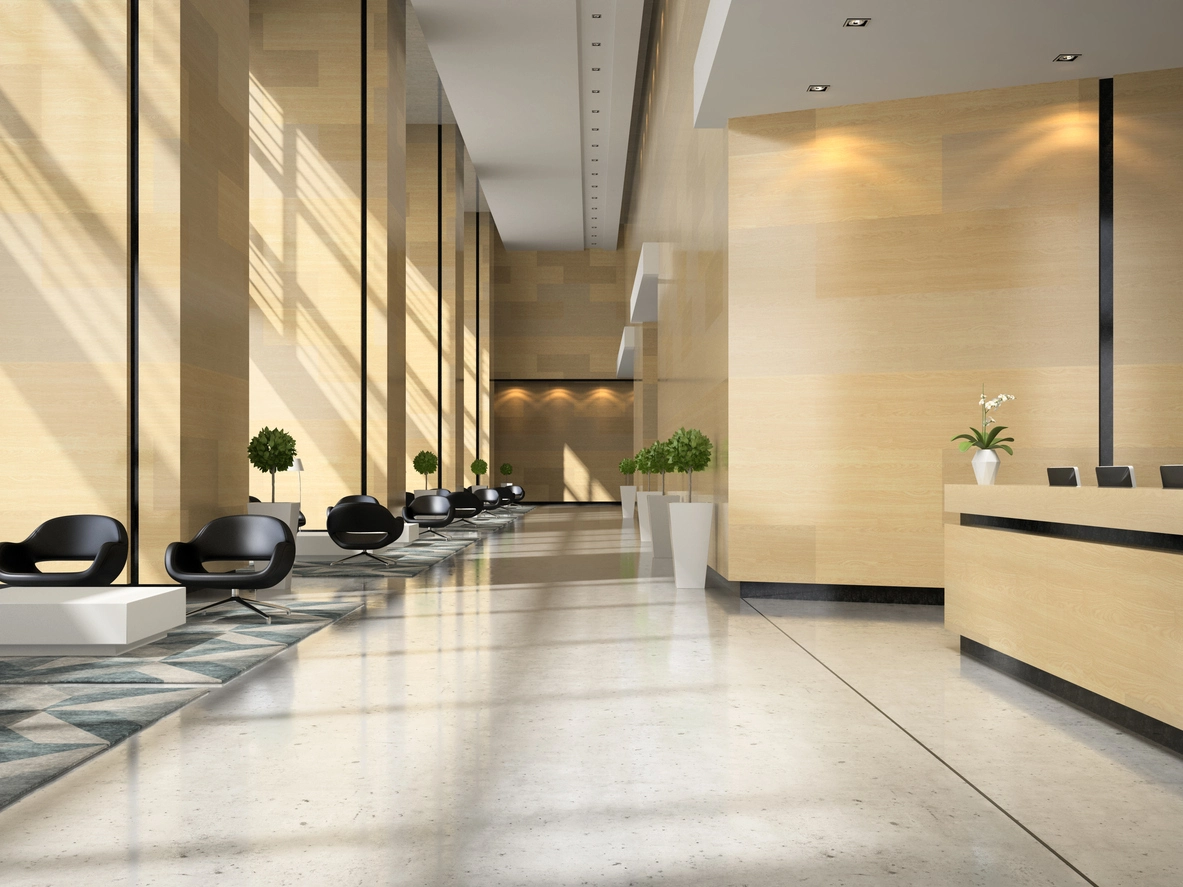
Review traffic concentration and movement through entrances, reception areas, and circulation paths.
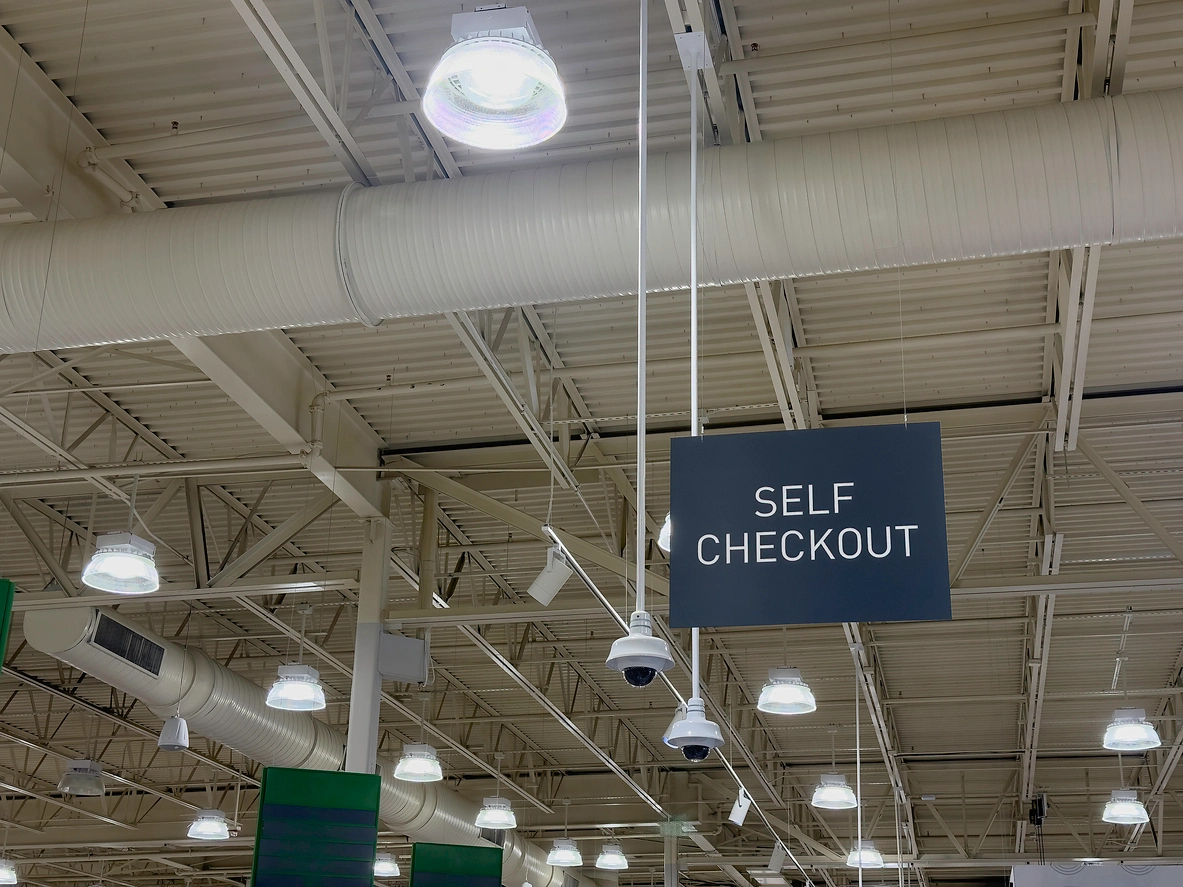
Understand customer flow between entrances, service counters, and waiting areas.
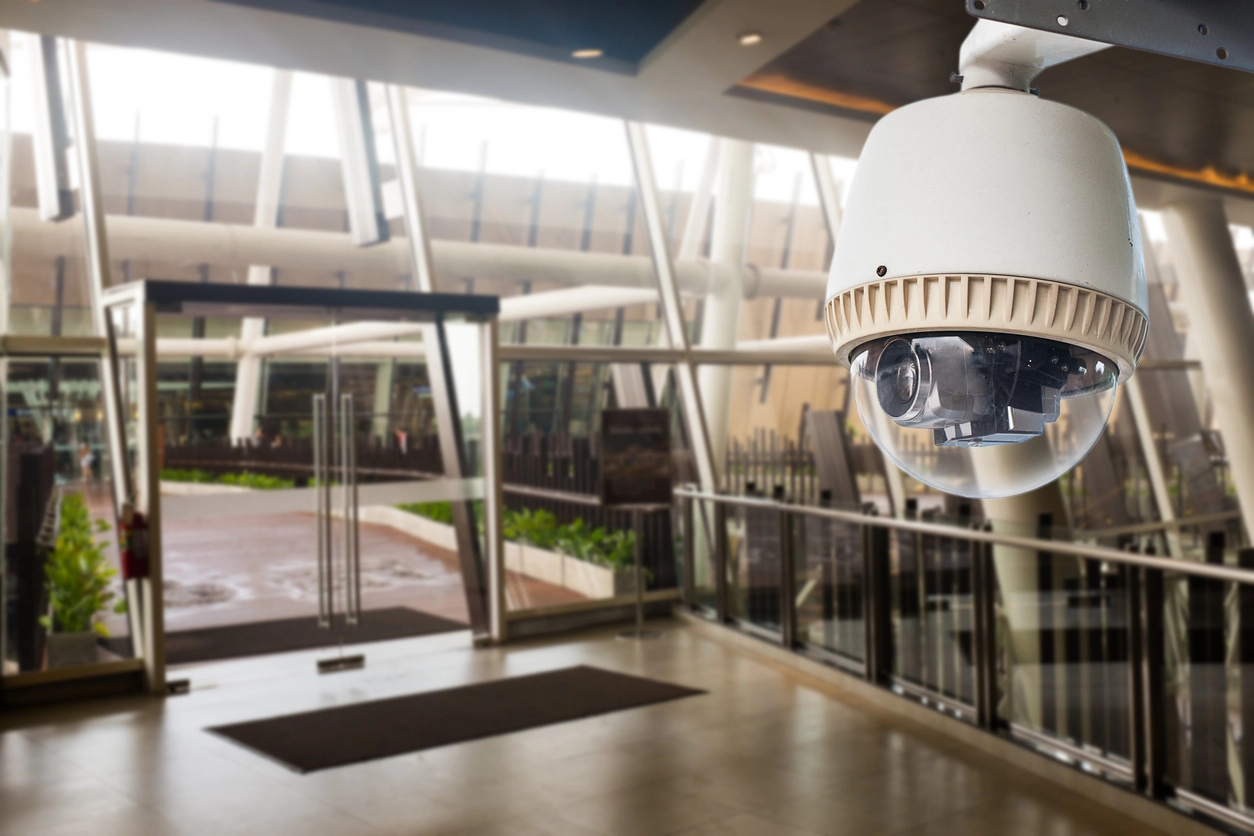
Visualize how people use common areas where broad traffic patterns matter.
Planning Considerations
A busy area on a heat map indicates activity or dwell time, but it does not explain the reason behind that behavior.
Organizations should combine heat-map data with staffing knowledge, store layout, promotions, schedules, signage, or other operational context before drawing conclusions.
Different analytics platforms may calculate heat maps using movement, dwell time, occupancy, or other measurements, so the reporting method should be understood before comparing results.
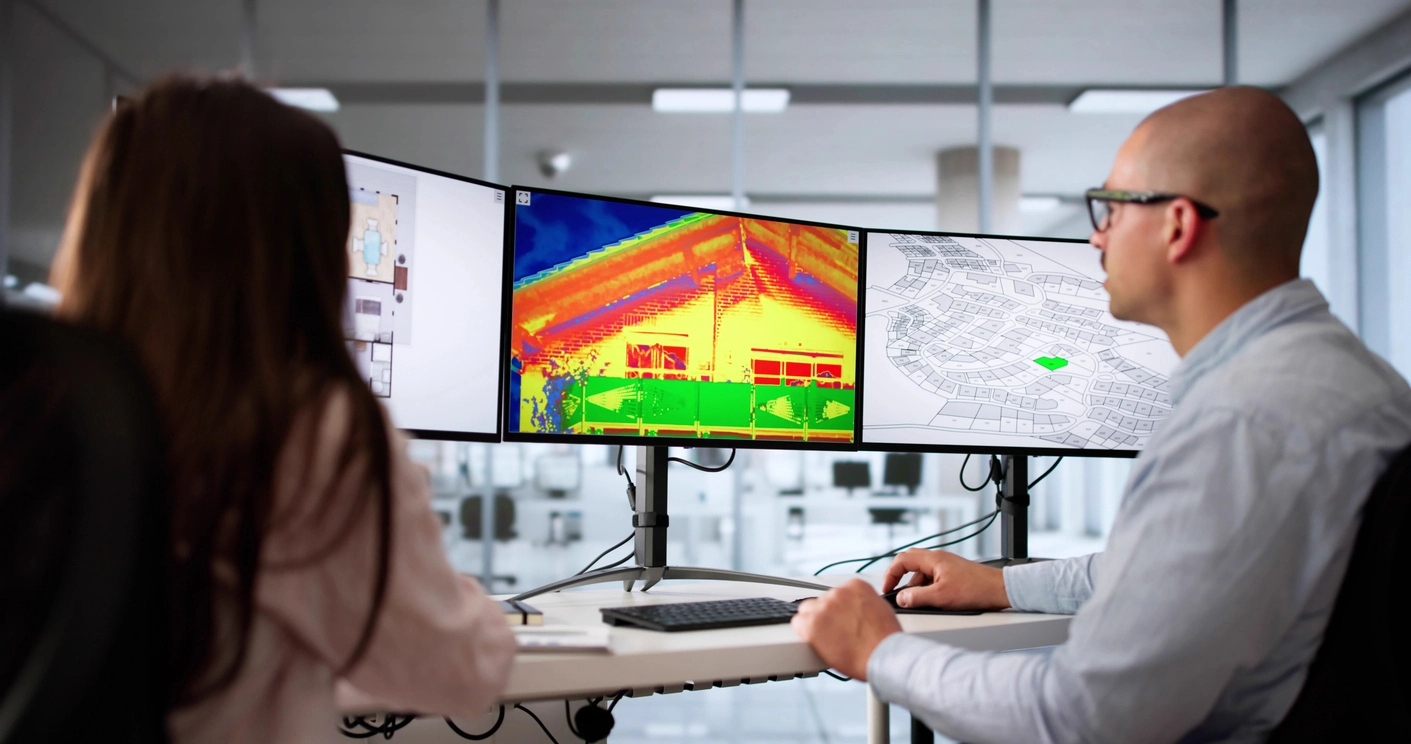
Useful heat maps depend on broad, stable camera coverage and consistent analytics.
The camera should cover enough of the area to show meaningful movement patterns.
A shifting or frequently repositioned view can make historical heat maps difficult to compare.
Hourly, daily, weekly, or campaign-level heat maps may answer different business questions.
Treat heat maps as one operational signal and combine them with real-world business context.
Heat mapping often works alongside people counting, occupancy monitoring, crowd analytics, retail surveillance, and centralized reporting.
Video heat mapping helps organizations visualize how people move through and use commercial spaces over time.
Heat maps can reveal high-traffic areas, low-traffic zones, dwell patterns, and changes in movement after a layout or operational change.
The analytics are especially useful in retail, hospitality, lobbies, public facilities, and other spaces where traffic flow affects staffing, customer experience, merchandising, or facility planning.
Camera Security Now helps organizations evaluate camera placement, analytics platforms, dashboards, recording, and reporting requirements for useful heat-map deployments.
Get answers to common questions about this security camera solution.
Video heat mapping uses analytics to visualize where people move or spend time within a monitored area over a selected period.
Some platforms incorporate dwell-time information, while others focus more heavily on movement density. Capabilities vary by manufacturer.
Not necessarily. Heat mapping is typically used to analyze aggregate movement patterns rather than identify specific individuals.
Yes. Retailers and facility managers may use traffic patterns to evaluate layouts, displays, signage, staffing, and other operational decisions.
Tell us which spaces and business questions matter. We’ll help you evaluate video heat mapping and supporting camera coverage.